Design modern UX Dashboard with Microsoft Power BI
Loại khoá học: Business Analytics & Intelligence
Take your dashboard design and reporting skills to the next level. Design modern reports and Dashboards with Power BI.
Mô tả
Course Overview
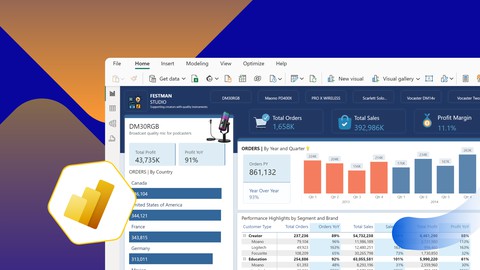
Welcome to this end-to-end Power BI dashboard design course. In this course, you'll step into the role of a business intelligence analyst for Festman Studio, a global company that provides premium recording equipment for content creators.
Throughout this course, you'll have the opportunity to develop your design and Power BI skills as you help Festman Studio management harness the power of Microsoft Power BI to transform their raw data into actionable insights.
Project Background
You have been employed as a Business Intelligence Developer at Festman Studio and your role is to harness the power of Microsoft Power BI to transform raw data into actionable insights. You will design compelling visualizations and comprehensive reports that guide decision-makers in steering Festman Studio toward sustained success.
Task
Import the two tables into Power BI.
Profile and transform the data to ensure the data is clean and accurate
Analyze the data using DAX to calculate some key metrics.
Visualize the data to bring your insights to life.
Design a dynamic and interactive dashboard to summarize your insights.
Learning Objectives
By the end of this course, you will be able to:
Import, clean, and transform data in Power BI
Analyze data using DAX to calculate key metrics
Create compelling visualizations using Power BI's visualization tools
Design and implement interactive Power BI dashboards
Bạn sẽ học được gì
Data Analysts
Power BI enthusiasts
Business Analysts
Accountants
Financial Analysts
Students
Yêu cầu
- Prior knowledge of Microsoft Power BI is required
- At least November 2023 version of Power BI Desktop
Nội dung khoá học
Viết Bình Luận
Khoá học liên quan


Đăng ký get khoá học Udemy - Unica - Gitiho giá chỉ 50k!
Get khoá học giá rẻ ngay trước khi bị fix.
Đánh giá của học viên
Bình luận khách hàng