Mô tả

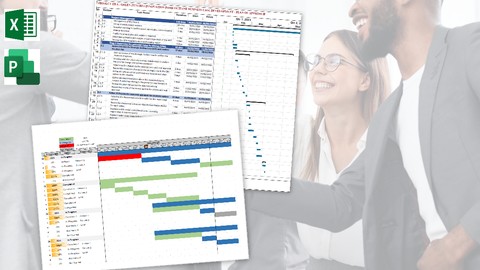
It’s been said that project management is 90 percent communication – and it can certainly feel that way when you consider all the people you have to communicate with daily. Did you know that you can use Microsoft Excel to help you communicate more effectively, define your project charter, build out the project scope, and even the work breakdown structure? You sure can!

It’s paramount that project managers work with the project team to plan and define the project scope. Then, when the team is executing the project work, the project manager needs to monitor and control the work. Part of monitoring and controlling is to record what’s happening in the project. Based on this work performance data, you’ll process the project’s successes (and possibly failures) and report to the project stakeholders accordingly.

Microsoft Excel can help you with so much of that! In this course, we’ll explore many things that Microsoft Excel can do for project management. We’ll dive into formatting, charting, conditional formatting, and building a custom dashboard and report. If you don’t have more advanced project management software, that’s okay; you can do much of that business in Microsoft Excel.

This course is worth five (5) Professional Development Units with the Project Management Institute. Take this course at your leisure, learn more about Microsoft Excel and project management, keep your PMI certification, and most importantly, manage your projects with better control and communication.

Bạn sẽ học được gì

Design reports for your stakeholders

Create a dashboard with some common project management requirements

Improve project communications with charts

Format, change, and edit charts

Apply conditional formatting to save time and automate reporting

Implement the Microsoft Excel Camera Tool

Create a speedometer chart for reporting

Claim five (5) Professional Development Units with PMI

Yêu cầu

  • Basics of project management
  • Basics of Microsoft Excel

Nội dung khoá học

6 sections

Reports and Dashboards

4 lectures
Course Overview
02:54
Section Overview
02:27
Comparing Reports and Dashboards
15:29
Section Close
01:23

Fundamentals of Microsoft Excel for Project Management

6 lectures
Section Overview
03:37
Set the Excel Table for Project Management
02:46
Exercise: Format Cell Numbering
05:42
Create a Clean and Concise Report by Formatting Numbers
04:16
Single-Line Accounting Underline
03:05
Section Close
02:03

Formatting in Microsoft Excel to show Project Performance

17 lectures
Section Overview
02:18
Sparklines! Add Sparkle to your Reports and Dashboards
02:12
Adding Sparklines to a Range of Cells
09:41
Using Conditional Formatting in Microsoft Excel
02:13
Experimenting with Conditional Formatting in Microsoft Excel
10:18
Applying Top/Bottom Rules in Microsoft Excel
02:08
Exercise: Applying Top/Bottom Rules
03:49
Customize Project Reports by Utilizing Data Bars
02:25
Exercise: Experimenting with Conditional Formatting Data Bars
06:42
Exercise: Color Scales and Conditional Formatting in Microsoft Excel
06:27
Quickly Format Reports by Adding Icon Sets
02:36
Exercise: Conditional Format and Icon Sets in Microsoft Excel
05:37
Manipulating Icon Sets
02:26
Exercise: Customizing the Icon Set
05:03
Take Control in Microsoft Excel by Manually Applying Conditional Formatting
02:20
Exercise: Manually Create Conditional Formatting
13:10
Section Close
01:24

Creating Charts in Microsoft Excel for Performance Reporting

9 lectures
Section Overview
02:45
Build Your Reports and Dashboards by Building Charts
03:27
Working with Excel Charts
09:40
Exercise: Experiments with Microsoft Excel Charts
05:43
Working With Chart Series
04:00
Exercise: Working with Series in Microsoft Excel
05:51
Format and Customize Charts
02:12
Exercise: Formatting Charts in Microsoft Excel
11:16
Section Close
00:46

Customizing Charts in Microsoft Excel for Project Management

12 lectures
Section Overview
02:23
Working with Chart Fills and Borders
02:46
Exercise: Managing Fills and Borders in Microsoft Excel
05:07
Get Fancy! Format the Chart Background
02:33
Using Pictures as Charts
02:39
Exercise: Using Pictures in Charts
04:43
Charts Need Names - Sometimes
03:53
Working With Gantt Charts
04:55
Exercise: Creating a Microsoft Excel Gantt Chart
12:04
Configure Earned Value Management for Microsoft Excel
09:51
Building an Earned Value Management Worksheet in Microsoft Excel
10:11
Section Wrap
01:44

Build a Custom Dashboard and Reports in Microsoft Excel

11 lectures
Section Overview
02:02
Secret Weapon: Microsoft Excel’s Camera Feature
03:01
Vroom! Vroom! Build a Project Speedometer
11:47
Experimenting with the Microsoft Excel Camera Feature
04:01
Make it Happen: Building Dashboards and Reports
03:20
Exploring the Project Charter and Project Scope within Microsoft Excel
05:17
Creating a Risk Log for Your Project Dashboard
03:30
Exercise: Creating a Risk Log in Microsoft Excel
04:10
Section Close
01:29
Course Wrap-Up
02:45
Bonus
00:03

Đánh giá của học viên

Chưa có đánh giá
Course Rating
5
0%
4
0%
3
0%
2
0%
1
0%

Bình luận khách hàng

Viết Bình Luận

Bạn đánh giá khoá học này thế nào?

image

Đăng ký get khoá học Udemy - Unica - Gitiho giá chỉ 50k!

Get khoá học giá rẻ ngay trước khi bị fix.