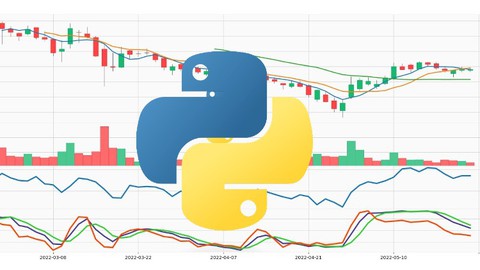
Building Technical Indicators in Python
Loại khoá học: Programming Languages
Learn to use Technical Indicators in your trading Strategies using Python
Mô tả
This course will provide students with a comprehensive understanding of how to use technical indicators and candlestick patterns in stock trading.
The course will start by covering the basics of technical indicators, and candlestick patterns including the use of third-party libraries in your strategy. Then, we will dive into the world of technical indicators and candlestick patterns.
Some of the most popular technical indicators that we will cover in this course include
Simple Moving Average (SMA), Exponential Moving Average (EMA),
Relative Strength Index (RSI),
Moving Average Convergence Divergence (MACD),
Bollinger Bands, and
Fibonacci Retracements.
We will also cover popular candlestick patterns such as Doji, Hammer, and Shooting Star.
To facilitate the implementation of these indicators and patterns, we will use popular libraries such as Talib, pandas TA, and tulip. We will also use popular charting libraries like matplotlib, plotly & mplfinance. These libraries will enable students to write code in Python to calculate and plot these indicators and patterns on price charts and provide them with the ability to analyze and make informed trading decisions. We will also include mathematical formulas used in these indicators along with custom code in case you want to develop your own indicator.
By the end of the course, students will have a strong understanding of how technical indicators and candlestick patterns work and how to use them to make profitable trades. Students will also have the necessary skills to implement these indicators and patterns using Python, and will be well-equipped to analyze market trends and make informed trading decisions.
Bạn sẽ học được gì
Yêu cầu
Nội dung khoá học
Viết Bình Luận
Khoá học liên quan


Đăng ký get khoá học Udemy - Unica - Gitiho giá chỉ 50k!
Get khoá học giá rẻ ngay trước khi bị fix.
Đánh giá của học viên
Bình luận khách hàng