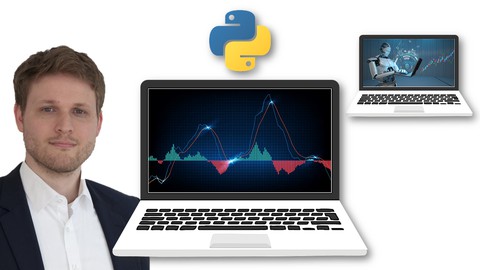
Mô tả

(Latest course update and full code review in May 2023!)


"(How) Can I use Technical Analysis and Technical Indicators for Trading and Investing?" - This is one of the most frequently asked questions in trading and investing.

This course clearly goes beyond rules, theories, vague forecasts, and nice-looking charts. (These are useful but traders need more than that.) This is the first 100% data-driven course on Technical Analysis. We´ll use rigorous Backtesting / Forward Testing to identify and optimize proper Trading Strategies that are based on Technical Analysis / Indicators.

This course will allow you to test and challenge your trading ideas and hypothesis. It provides Python Coding Frameworks and Templates that will enable you to code and test thousands of trading strategies within minutes. Identify the profitable strategies and scrap the unprofitable ones!     


The course covers the following Technical Analysis Tools and Indicators:

  • Interactive Line Charts and Candlestick Charts

  • Interactive Volume Charts

  • Trend, Support and Resistance Lines

  • Simple Moving Average (SMA)

  • Exponential Moving Average (EMA)       

  • Moving Average Convergence Divergence (MACD)

  • Relative Strength Index (RSI)

  • Stochastic Oscillator

  • Bollinger Bands

  • Pivot Point (Price Action)

  • Fibonacci Retracement (Price Action)

  • combined/mixed Strategies and more.


This is not only a course on Technical Analysis and Trading. It´s an in-depth coding course on Python and its Data Science Libraries Numpy, Pandas, Matplotlib, Plotly, and more. You will learn how to use and master these Libraries for (Financial) Data Analysis, Technical Analysis, and Trading.   

Please note: This is not a course for complete Python Beginners (check out my other courses!)


What are you waiting for? Join now and start making proper use of Technical Analysis!

As always, there is no risk for you as I provide a 30-Days-Money-Back Guarantee.

Thanks and looking forward to seeing you in the Course!

Bạn sẽ học được gì

Yêu cầu

Nội dung khoá học

17 sections

Getting Started

6 lectures
What is Technical Analysis? / Course Overview
05:16
Tips: How to get the most out of this course
05:27
Did you know...? (what Data can tell us about Technical Analysis)
01:57
Student FAQ
02:07
*** LEGAL DISCLAIMER (MUST READ!) ***
00:37
Course Materials / Download (Updated: May 2023)
01:32

Installing Python and Jupyter Notebooks

4 lectures
Overview
00:39
Download and Install Anaconda
06:15
How to open Jupyter Notebooks
12:24
How to work with Jupyter Notebooks
17:25

Technical Analysis with Python - an Introduction

13 lectures
Overview
01:15
Installing and importing required Libraries/Packages
03:03
IMPORTANT NOTICE
00:13
Loading Financial Data from the Web
07:14
Charting - Simple Line Charts
05:00
Charting - Interactive Line Charts with Cufflinks and Plotly
04:28
How to customize Plotly Charts
04:07
Candlestick and OHLC Bar Charts
06:09
Bar Size / Granularity
08:19
Volume Charts
03:35
Technical Indicators - Overview and Examples
03:32
Trend Lines
04:09
Support and Resistance Lines
05:11

Technical Analysis - Theory and Use Cases

5 lectures
Section Overview
00:58
Technical Analysis vs. Fundamental Analysis
05:58
Technical Analysis and the Efficient Market Hypothesis (EMH)
04:53
Technical Analysis - Applications and Use Cases
09:15
An Introduction to Currencies (FOREX) and Trading
07:26

Simple Moving Averages (SMA) and Introduction to Backtesting

21 lectures
Introduction
03:07
Getting the Data
03:56
A simple Buy and Hold "Strategy"
05:20
Performance Metrics
06:33
SMA Crossover Strategies - Overview
04:05
Defining an SMA Crossover Strategy
07:00
Vectorized Strategy Backtesting
08:16
Finding the optimal SMA Strategy
11:24
Generalization with OOP: An SMA Backtesting Class in action
10:19
OOP: the special method __init__()
04:02
OOP: the method get_data()
09:06
OOP: the method set_parameters()
06:20
OOP: the method test_strategy()
04:58
OOP: the method plot_results()
03:12
OOP: the method update_and_run()
04:40
OOP: the method optimize_parameters()
03:10
OOP: Docstrings and String Representation
04:51
Trading Costs (Part 1)
06:11
Trading Costs (Part 2)
06:42
Trading Costs (Part 3)
02:52
Special Case: Price/SMA Crossover
02:12

Exponential Moving Averages (EMA)

8 lectures
Introduction
00:48
EMA Crossover Strategies - Overview
02:40
Getting the Data
00:47
EMA vs. SMA
05:22
Defining an EMA Crossover Strategy
03:36
Vectorized Strategy Backtesting
05:46
OOP Challenge: Create the EMA Backtesting Class (incl. Solution)
02:53
The EMA Backtesting Class in Action
05:13

SMA / EMA Crossover Strategies (Coding Challenge)

4 lectures
Introduction
00:36
SMA / EMA Crossover Strategies - Overview
01:30
Instructions & some Hints
00:52
Solution
06:09

Moving Average Convergence Divergence (MACD)

9 lectures
Introduction
00:43
MACD Strategies - Overview
05:05
Getting the Data
00:55
Defining an MACD Strategy (Part 1)
05:59
Defining an MACD Strategy (Part 2)
02:49
Vectorized Strategy Backtesting
04:29
The MACD Backtesting Class in Action
09:19
OOP Challenge: Create the MACD Backtesting Class (incl. Solution)
05:37
Alternative MACD Strategies and Interpretations
05:57

Relative Strength Index (RSI)

9 lectures
Introduction
00:50
RSI Strategies - Overview
03:47
Getting the Data
00:30
Defining an RSI Strategy (Part 1)
07:54
Defining an RSI Strategy (Part 2)
05:49
Vectorized Strategy Backtesting
03:12
The RSI Backtesting Class in Action
08:11
OOP Challenge: Create the RSI Backtesting Class (incl. Solution)
03:03
Alternative RSI Strategies and Interpretations
04:26

Working with two or many Indicators - MACD & RSI

4 lectures
Introduction
00:57
A combined MACD / RSI Strategy - Overview
02:26
Backtesting and Optimizing the Strategies separately
02:48
Combining MACD with RSI and Backtesting
04:29

Stochastic Oscillator

7 lectures
Introduction
00:43
Getting the Data
01:45
Defining an SO Strategy
08:41
Vectorized Strategy Backtesting
02:54
The SO Backtesting Class in Action
08:53
OOP Challenge: Create the SO Backtesting Class (incl. Solution)
04:04
Alternative SO Strategies and Interpretations
03:29

Bollinger Bands

8 lectures
Introduction
01:01
Bollinger Bands - Overview
02:57
Getting the Data
02:45
Defining a Bollinger Bands Mean-Reversion Strategy (Part 1)
04:29
Defining a Bollinger Bands Mean-Reversion Strategy (Part 2)
08:36
Vectorized Strategy Backtesting
05:48
The BB Backtesting Class in action
03:55
OOP Challenge: Create the BB Backtesting Class (incl. Solution)
02:40

Pivot Point Strategies

11 lectures
Introduction
01:09
Pivot Point - Overview and Data requirements
05:28
Adding Pivot Point and Support and Resistance Lines
04:19
Defining a simple Pivot Point Strategy
05:18
Vectorized Strategy Backtesting
04:55
Starting with raw Data
02:03
Preparing the Data (1) - Timezone Conversion
03:07
Preparing the Data (2) - Resampling to daily (NY Close)
04:23
Preparing the Data (3) - OHLC Resampling
02:34
Preparing the Data (4) - Merging Intraday and Daily Data
04:48
Final Remarks - Now it´s your turn!
01:11

Fibonacci Retracement Strategies

12 lectures
Introduction
00:58
Getting the Data
00:52
A first Intuition on Fibonacci Retracement (Uptrend)
08:58
A first Intuition on Fibonacci Retracement (Downtrend)
04:37
Identifying Local Highs
06:08
Identifying Local Lows
04:50
Highs and Lows - an iterative approach
05:42
Identifying Trends (Uptrend / Downtrend)
04:28
Adding Fibonacci Retracement Levels
02:25
A Fibonacci Retracement Breakout Strategy
07:57
Vectorized Strategy Backtesting
04:04
Final Remarks and alternative Strategies
01:52

Appendix 1: Introduction to Time Series Data and Financial Analysis in Pandas

26 lectures
Introduction
00:47
Importing Time Series Data from csv-files
08:16
Converting strings to datetime objects with pd.to_datetime()
08:53
Indexing and Slicing Time Series
07:25
Downsampling Time Series with resample()
14:20
Coding Exercise 1
05:10
Getting Ready (Installing required library)
02:20
Importing Stock Price Data from Yahoo Finance
09:29
Initial Inspection and Visualization
05:32
Normalizing Time Series to a Base Value (100)
06:31
The shift() method
06:51
The methods diff() and pct_change()
06:41
Measuring Stock Performance with MEAN Returns and STD of Returns
08:49
Financial Time Series - Return and Risk
08:30
Financial Time Series - Covariance and Correlation
04:32
Coding Exercise 2
00:04
Simple Returns vs. Log Returns
09:18
Importing Financial Data from Excel
11:25
Simple Moving Averages (SMA) with rolling()
08:44
Momentum Trading Strategies with SMAs
07:08
Exponentially-weighted Moving Averages (EWMA)
04:32
Merging / Aligning Financial Time Series (hands-on)
05:02
Helpful DatetimeIndex Attributes and Methods
06:24
Filling NA Values with bfill, ffill and interpolation
10:07
Timezones and Converting (Part 1)
04:36
Timezones and Converting (Part 2)
04:48

Appendix 2: Object Oriented Programming (OOP): The Financial Instrument Class

18 lectures
Introduction
00:21
Introduction to OOP and examples for Classes
10:58
Required Packages
00:06
The Financial Analysis Class live in action (Part 1)
04:58
The Financial Analysis Class live in action (Part 2)
03:42
The special method __init__()
08:28
The method get_data()
06:49
The method log_returns()
03:21
String representation and the special method __repr__()
03:41
The methods plot_prices() and plot_returns()
05:21
Encapsulation and protected Attributes
04:02
The method set_ticker()
03:18
Adding more methods and performance metrics
05:51
Inheritance
09:01
Inheritance and the super() Function
06:47
Adding meaningful Docstrings
06:24
Creating and Importing Python Modules (.py)
04:19
Coding Exercise 3: Create your own Class
07:13

What´s next? (outlook and additional resources)

1 lectures
Bonus Lecture
05:06

Đánh giá của học viên

Chưa có đánh giá
Course Rating
5
0%
4
0%
3
0%
2
0%
1
0%

Bình luận khách hàng

Viết Bình Luận

Bạn đánh giá khoá học này thế nào?

image

Đăng ký get khoá học Udemy - Unica - Gitiho giá chỉ 50k!

Get khoá học giá rẻ ngay trước khi bị fix.