Dynamic Dashboards and Data Analysis with Data Studio - 2022
Loại khoá học: Business Analytics & Intelligence
Learn how to build powerful data visualizations and unlock insights with ease in Google Data Studio

Mô tả
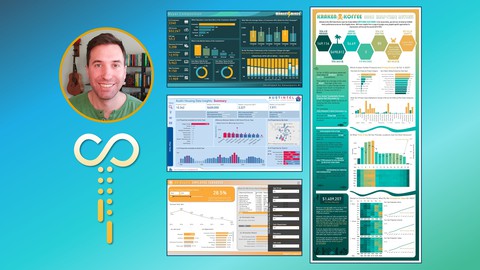
Welcome to Dynamic Dashboards and Data Analysis with Google Data Studio! In this course, you will learn how to build powerful data visualizations and unlock insights that can help you drive business results for your clients or employers. This course aims to strike a balance between the foundations of data analysis and hands-on practical examples. The course starts with an introductory view of key concepts such as aggregation, pivot tables, calculated fields, data blending and then dives into real-world projects, including:
Project 1: Create a User Journey Funnel with Google Analytics
Project 2: Create a device breakdown visualization with user-level data
NEW* Dashboard Building Challenge: Create a dashboard in 10 minutes and get feedback from the instructor and/or your fellow students! (Assignment)
By the end of the course, you will be able to:
Use and understand all chart types throughout the course (Bullets, Pie Charts, Scorecards, Scatter plot and etc.)
Connect and blend data sources from Google Analytics and Google Sheets
Create custom dimensions with conditional expressions (CASE + REGEXP_MATCH + IN)
Build a user journey funnel with Google Analytics data based on a "Page Title" dimension
Create a device breakdown visualization and explore user-level data with scatter plot (eCommerece)
Create a Google BigQuery table based on a specific SQL query and visualize it in Data Studio
Create time series with rolling dates and interaction filters
Configure Gauge charts to track performance against a specific goal or KPI
Automate reports with advanced date selection filters
Understand the access levels in Data Studio "Owner" vs "Viewer"
Apply conditional formatting rules to signal data anomalies
Extract a report theme and colour scheme from an image in Data Studio
Apply IF statements within a CASE and use operators
What are the students who took the course saying?
"The pace of the course was great and I was able to follow along with all the exercises using the provided data files and Google Analytics demo account" - Tricia
"The course is fantastic. The instructor was clear and on-point when it came to the content. Lachezar took me from a complete beginner to someone who can actually build dashboards and understand how DS works.
I was blown away by how relatively short the video content was compared to the value I received - if you go beyond what's instructed and dive deep to recreate every single step (and dashboard) presented in this course yourself, it'll take you easily 10-15 hours of work to do.
This is a no fluff course, updated, with great support from the instructor - I urge you to go for it." - Roi
"This course has been very very done, clear and insightful. I will start to use Data studio from today on." - Silvia
Who is the instructor?
Lachezar Arabadzhiev is a digital markitech with 4+ years of experience in performance analytics and data visualization. Lachezar began his career as a digital marketer at Microsoft, but soon transitioned to the measurement and analytics world, where he has had the opportunity to work with major brands such as Air Canada, RBC, Kimberly-Clark, Mazda and HSBC.
Lachezar has been working with Data Studio and BigQuery since early 2017 and has built a wide variety of visualizations and automation flows. From performance-based dashboards with joined GMP sources (Google Analytics 360, Campaign Manager and Display & Video 360) to audience-driven segmentation views with user-level eCommerce data.
Lachezar is a certified GMP expert and an official speaker at the Canadian Google Data & Analytics Summit, 2018.
Bonus
The course includes custom Google Sheets data sets for each section, a Data Studio Solutions Manual and a FREE Dashboard Template upon completion of the course. And don't worry, if the course does not work out for you, you can always get your money back in 30 days.
Bạn sẽ học được gì
Understand the art of capturing data-driven insights and visual storytelling
Use all chart types throughout the course (Bullets, Pie Charts, Scorecards, Scatter plot and etc.)
Get familiar with Google BigQuery for Google Data Studio
Build advanced dashboards with pivot tables and use the "Expand-collapse" function
Connect and blend data sources, and learn about dimension cardinlity
Build a user journey funnel with Google Analytics data (Practical Example #1)
Create a device breakdown visualization with user-level data (Practical Example #2)
Create custom dimensions with conditional expressions (CASE + REGEXP_MATCH + IN)
Explore dashboard design and conditional formatting
Create time series with rolling dates and interaction filters
Get a FREE dashboard template
Yêu cầu
- Gmail Account (Free)
- Google Data Studio Registration (Free)
- Google Analytics Demo Account (Free and Provided)
- Google BigQuery Account (Free)
Nội dung khoá học
Viết Bình Luận
Khoá học liên quan


Đăng ký get khoá học Udemy - Unica - Gitiho giá chỉ 50k!
Get khoá học giá rẻ ngay trước khi bị fix.
Đánh giá của học viên
Bình luận khách hàng