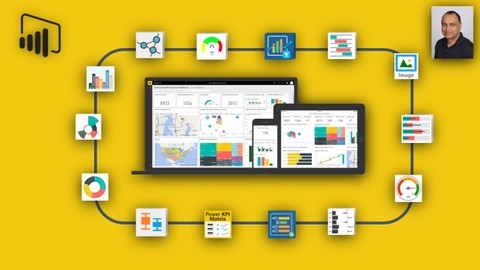
Mô tả

Learn to create stunning Dashboards and Reports using Microsoft's free Business Intelligence / Analytics tool, Power BI.

Do you want to build professional-quality Business Intelligence Reports from the ground up ? Do you want to blend and transform raw data into beautiful Interactive Dashboards ? Do you want to learn design and implement the same B.I. tools used by professional analysts and data scientists ? Do you want to understand the Business Intelligence workflow from end-to-end.

 Then Microsoft Power BI is the right tool for you and this comprehensive course will teach you everything you need to know to use Power BI. 

 This hands on (Beginner to Intermediate) course will prepare you to start your data analytics career and also will prepare you to Successfully  implement Power BI in your organization. Absolutely no experience is required. 25+ hours of HD videos of building 18  interactive Business Intelligence Reports and Dashboards (real-world examples) from scratch to finish. Files for Start and Finished projects also included to challenge you so you can learn by immediately applying what you're learning .  You will have gained the knowledge and confidence to apply these same concepts to real-word to solve the Business problems or Business requirements. 

By the time you complete this course, You'll be a highly proficient Power BI user. You'll be fully prepared to collect, clean, model and present data for any purpose.  You will be using your skills as a Business Intelligence Professional to extract knowledge from data so you can analyze and visualize complex Business Problems/Requirements with ease.

 Why should you consider a career as a Business Data Analyst? 

  • Salary. A Business Data Analyst is a well-paid career 

  • Stable Career. As most corporations gathering more and more data. There will never be shortage of Jobs for Business Data Analyst. 

  • Advancement in Career : Since you will be building different reports for different departments. You will never be bored and always be valued. Which will bring you more opportunities in your career.  Business Data Analyst get very visibility in corporations. Whole management depends on them.  

#microsoft #powerbi #data #business #intelligence #analysis

Course Curriculum:

Section 1: Business intelligence -

  • Introduction to Power BI

  • Business Analysis - Course Introduction

  • Thank you for enrolling - Must watch

  • Dashboard-in-a-day & Power BI Best Practices Introduction

  • Power Bi Introduction - 0

  • Power Bi Introduction - 1

  • Power Bi Introduction - 2

  • Why Microsoft Power BI

  • Power BI Family

  • Power BI Desktop

  • Power BI Service 1

  • Power BI Service 2

  • Descriptive-Predictive-Prescriptive Analytics

  • IT Challenges 0

  • IT Challenges 1

  • How to take the quizzes


Section 2: Data Analysis and Business Intelligence - Collect , Injest and  Import Data

  • Download Data files first

  • Import data from CSV files

  • Import data from Excel files

  • Import data from Web 1

  • Import data from Web 2

  • Import Real-time Streaming Data

  • Download and Install SQL Server Express

  • Download and Install Sample Databases

  • Import data from SQL Server

  • Import data from OData feed REST-API

  • Import Data from Folder

  • Dataflows - Introduction

  • Dataflows - Create Gateway from Scratch

  • Dataflows - Create Entities from CSV file

  • Dataflows - Create Entities Using SQL Server


Section 3: Prep, Clean and Shape Data

  • Download resources for this section.

  • Remove Rows

  • Remove Columns

  • Make first row as headers

  • How to create calculate columns

  • How to remove duplicates,  Unpivot columns and split columns

  • Change Data type, Replace Values and Rearrange the columns

  • Append Queries

  • Merge Queries


Section 4: Power BI Visuals

  • Download resources for this section.

  • Visuals Intro

  • Visuals-Bar Charts

  • Visuals-Line Charts

  • Visuals-Pie Chart

  • Stacked bar Chart

  • Clustered Column Chart

  • Visuals-Area Chart and Analytics Tab Explained-0

  • Visuals-Area Chart and Analytics Tab Explained-1

  • Visuals-Combo Chart

  • Visuals-Scatter Chart

  • Visuals-Treemap Chart

  • Visuals-funnel Chart

  • Visuals-Card and Multi-Row Card

  • Visuals-Gauge Card

  • Visuals-KPIs

  • Visuals-Matrix

  • Visuals-Table

  • Visuals-Text boxes - Shapes - Images

  • Visuals-Slicers

  • Visuals-Maps

  • Custom Visuals - Word Cloud

  • Visualization interactions


Section : AI Visuals - ChatGPT and Microsoft CoPilot

  • AI Visuals - ChatGPT and Microsoft CoPilot (2min)

  • Decomposition Tree Visual (15 min)

  • Key Influencers Visual (16 min)

  • Smart Narrative (12 min)

  • Q&A Visual (17 min)

  • Quick Measures with CoPilot (16 min)

  • Column from Examples (15 min)

  • New Calculation - Model Tab (25 min)

  • Field Parameters (7 min)

  • Bravo Tool (24 min)

  • ChatGPT - Power BI CoPilot DAX Example (17 min)

  • ChatGPT - Power BI CoPilot M Code Example (13 min)


Section 5: Data Modeling

  • Our First Report-0

  • Our First Report-1

  • Our First Report-2

  • Our First Report-3

  • Publishing and Sharing your first report

  • Theme Download file

  • Modeling Basics-0

  • Modeling Basics-1

  • Modeling Basics-2

  • Modeling and Relationships-0

  • Modeling and Relationships-1

  • Other ways to create Relationship

  • Normalization - Denormalization-0

  • Normalization - Denormalization-1

  • OLTP vs OLAP

  • Star Schema vs Snowflake Schema-0

  • Star Schema vs Snowflake Schema-1


Section 6: Introduction to DAX

  • DAX101 - Importing Data for Dax Learning

  • DAX101 - Resources for Dax Learning

  • DAX101 - What is Dax

  • DAX101 - Dax Data Types

  • DAX101 - Dax Operators and Syntax

  • DAX101 - M vs Dax

  • DAX101 - Create a Column

  • DAX101 - Rules to Create Measures

  • DAX101 - Calculated Columns vs Calculated Measures-0

  • DAX101 - Calculated Columns vs Calculated Measures-1

  • DAX101 - Sum()

  • DAX101 - AVERAGE()-MIN()-MAX()

  • DAX101 - SUMX()

  • DAX101 - DIVIDE()

  • DAX101 - COUNT()-COUNTROWS()

  • DAX101 - CALCULATE()-0

  • DAX101 - CALCULATE()-1

  • DAX101 - FILTER()

  • DAX101 - ALL()

  • DAX101 - Time Intelligence - Create Date Table in M (important)

  • DAX101 - Time Intelligence - Create Date Table in DAX-0

  • DAX101 - Time Intelligence - Create Date Table in DAX-1

  • DAX101 - Time Intelligence - PREVIOUSMONTH()

  • DAX101 - Time Intelligence - SAMEPERIODLASTYEAR()

  • DAX101 - Time Intelligence - TOTALYTD()

  • DAX101 - Display Last Refresh Date

  • DAX101 - Time Intelligence - DATEADD()

  • DAX101 - Quick Measures


Section 7: Hands-on Real-world Projects

  1. Delicious Pizza

  2. American Bank

  3. Financial Report

  4. Productivity in 2017

  5. Personality

  6. Tough Sport by Skill

  7. Natural Disasters

  8. Terrorism in World

  9. Procurement-spend Analysis

  10. Products Analysis

  11. Regional Analysis

  12. IT Tickets Analysis

  13. Human Resources 1

  14. Human Resources 2

  15. Human Resources 3

  16. Financial Data Report

  17. Sales Analysis

  18. Bank Report


Section 8: Personal - Enterprise Gateway

  • On-Premises Gateway

  • Personal vs Enterprise Gateway

  • Install and Configure Personal Gateway

  • Install and Configure Enterprise Gateway

  • Manage SQL Server Data Source thru Enterprise Gateway


Section 9: Power BI Service and Dashboards

  • PowerBI Reports

  • PowerBI Workspaces

  • PowerBI Datasets

  • What are Dashboards

  • How to create Workspace and Publish Report

  • Create dashboards 6 different ways-0

  • Create dashboards 6 different ways-1

  • Favorite dashboards, reports, and apps in Power BI

  • Subscribe to a Report or Dashboard

  • Rename Workspace or Report or Dashboard

  • Display Reports or Dashboards in Full screen mode

  • Delete Reports or Dashboards

  • Dashboard Menus

  • Quick Insights

  • Setting up Alerts on Cards

  • Q-A in Power BI

  • Analyze in Excel

  • File and View Options

  • Printing Dashboard and Reports

  • Row level security

  • Access Reports Dashboards using Mobile Devices

  • Report page tooltip-0

  • Report page tooltip-1

  • Filter- Page-Report-Visualization level-0

  • Filter- Page-Report-Visualization level-1


Section 10: Sharing and Collaboration

  • Sharing and Collaboration

  • Sharing Dashboard

  • Sharing Workspaces

  • Sharing App

  • Publish To Web


Section 11: Bonus Lectures

  • Download Materials

  • Power BI : Best Practices, Tips and Tricks 0

  • Power BI : Best Practices, Tips and Tricks 1

  • Power BI : Best Practices, Tips and Tricks 2

  • Power BI : Best Practices, Tips and Tricks 3

  • Power BI : Best Practices, Tips and Tricks 4

  • Power BI : Best Practices, Tips and Tricks 5

  • Dashboard-in-a-day : Download Material link

  • Dashboard-in-a-day : Introduction

  • Dashboard-in-a-day : Accessing Data

  • Dashboard-in-a-day : Data Preparation 0

  • Dashboard-in-a-day : Data Preparation 1

  • Dashboard-in-a-day : Data modeling and Exploration 0

  • Dashboard-in-a-day : Data modeling and Exploration 1

  • Dashboard-in-a-day : Data modeling and Exploration 2

  • Dashboard-in-a-day : Data modeling and Exploration 3

  • Dashboard-in-a-day : Data modeling and Exploration 4

  • Dashboard-in-a-day : Data Visualizations 0

  • Dashboard-in-a-day : Data Visualizations 1

  • Dashboard-in-a-day : Publishing Report

  • Dashboard-in-a-day : Creating Dashboards 0

  • Dashboard-in-a-day : Creating Dashboards 1

  • Dashboard-in-a-day : 6 ways to create Dashboards 0

  • Dashboard-in-a-day : 6 ways to create Dashboards 1


Bạn sẽ học được gì

Yêu cầu

Nội dung khoá học

17 sections

Business intelligence - Course Introduction

2 lectures
Business Analysis - Course Introduction
11:31
Thank you for enrolling & How to get support
03:10

What is Business Intelligence and why companies use it

6 lectures
What is Business Intelligence
03:43
Why use Business Intelligence
08:09
What answers Business Intelligence gives a business
10:45
Characteristics of Modern BI Tools
10:28
Factors to consider while buying business intelligence solution
07:25
Descriptive-Predictive-Prescriptive Analytics
03:46

Introduction to Power BI

10 lectures
Power Bi Introduction - 0
02:11
Power Bi Introduction - 1
08:24
Power Bi Introduction - 2
07:05
Why Microsoft Power BI
04:17
Power BI Family
08:16
Power BI Desktop
08:35
Power BI Service 1
11:21
Power BI Service 2
04:11
IT Challenges 0
04:59
IT Challenges 1
04:57

Data Analysis and Business Intelligence - Collect , Injest and Import Data

15 lectures
Download Data files first
00:05
Import data from CSV files in Power BI
04:30
Import data from Excel files in Power BI
04:15
Import data from Web 1 in Power BI
12:02
Import data from Web 2 in Power BI
06:18
Import Real-time Streaming Data in Power BI
09:35
Download and Install SQL Server Express
07:56
Download and Install Sample Databases
08:22
Import data from SQL Server in Power BI
07:38
Import data from OData feed REST-API in Power BI
02:29
Import Data from Folder in Power BI
06:12
Dataflows - Introduction
05:31
Dataflows - Create Gateway from Scratch
08:14
Dataflows - Create Entities from CSV file
13:17
Dataflows - Create Entities Using SQL Server
10:54

Power Query : Prep, Clean and Shape Data

10 lectures
Download resources for this section.
00:05
Remove Rows in Power BI
02:47
Remove Columns in Power BI
02:10
Make first row as headers
01:36
How to create calculate columns
05:52
How to remove duplicates in Power BI
03:06
Unpivot columns and split columns in Power BI
05:41
Change Data type, Replace Values and Rearrange the columns in Power BI
03:27
Append Queries using Power BI
10:02
Merge Queries using Power BI
08:09

Power BI Visuals

23 lectures
Download resources for this section.
00:03
Visuals Intro
06:54
Visuals-Bar Charts in Power BI
12:27
Visuals-Line Charts in Power BI
06:43
Visuals-Pie Chart in Power BI
07:45
Stacked bar Chart in Power BI
05:31
Clustered Column Chart in Power BI
04:46
Visuals-Area Chart and Analytics Tab Explained-0 in Power BI
12:49
Visuals-Area Chart and Analytics Tab Explained-1 in Power BI
11:01
Visuals-Combo Chart in Power BI
06:42
Visuals-Scatter Chart in Power BI
09:36
Visuals-Treemap Chart in Power BI
05:51
Visuals-funnel Chart in Power BI
06:11
Visuals-Card and Multi-Row Card
13:48
Visuals-Gauge Card in Power BI
07:12
Visuals-KPIs in Power BI
05:52
Visuals-Matrix in Power BI
09:43
Visuals-Table in Power BI
04:39
Visuals-Text boxes - Shapes - Images
18:26
Visuals-Slicers in Power BI
10:08
Visuals-Maps in Power BI
07:45
Custom Visuals - Word Cloud in Power BI
12:22
Visualization interactions in Power BI
06:24

AI Visuals - ChatGPT and Microsoft CoPilot

12 lectures
AI Visuals - ChatGPT and Microsoft CoPilot
01:46
Decomposition Tree Visual
15:26
Key Influencers Visual
16:03
Smart Narrative
12:05
Q&A Visual
16:32
Quick Measures with CoPilot
15:32
Column from Examples
15:12
New Calculation - Model Tab
25:00
Field Parameters
07:08
Bravo Tool
23:50
ChatGPT - Power BI CoPilot DAX Example
17:11
ChatGPT - Power BI CoPilot M Code Example
12:49

Data Modeling in Power BI

17 lectures
Our First Report-0
10:41
Our First Report-1
09:45
Our First Report-2
10:07
Our First Report-3
09:46
Publishing and Sharing your first report
10:13
Theme Download file
00:02
Modeling Basics-0
10:21
Modeling Basics-1
06:24
Modeling Basics-2
04:51
Modeling and Relationships-0
08:53
Modeling and Relationships-1
07:27
Other ways to create Relationship
04:34
Normalization - Denormalization-0
09:44
Normalization - Denormalization-1
06:41
OLTP vs OLAP
08:02
Star Schema vs Snowflake Schema-0
08:36
Star Schema vs Snowflake Schema-1
08:30

Introduction to DAX using Power BI

28 lectures
DAX101 - Importing Data for Dax Learning
06:31
DAX101 - Resources for Dax Learning
06:00
DAX101 - What is Dax
05:09
DAX101 - Dax Data Types
04:07
DAX101 - Dax Operators and Syntax
08:20
DAX101 - M vs Dax
08:32
DAX101 - Create a Column
05:39
DAX101 - Rules to Create Measures
06:37
DAX101 - Calculated Columns vs Calculated Measures-0
08:48
DAX101 - Calculated Columns vs Calculated Measures-1
06:19
DAX101 - Sum()
06:06
DAX101 - AVERAGE()-MIN()-MAX()
04:22
DAX101 - SUMX()
06:27
DAX101 - DIVIDE()
06:48
DAX101 - COUNT()-COUNTROWS()
09:42
DAX101 - CALCULATE()-0
08:42
DAX101 - CALCULATE()-1
05:51
DAX101 - FILTER()
10:51
DAX101 - ALL()
08:47
DAX101 - Time Intelligence - Create Date Table in M (important)
10:47
DAX101 - Time Intelligence - Create Date Table in DAX-0
07:36
DAX101 - Time Intelligence - Create Date Table in DAX-1
07:59
DAX101 - Time Intelligence - SAMEPERIODLASTYEAR()
06:27
DAX101 - Time Intelligence - TOTALYTD()
06:34
DAX101 - Display Last Refresh Date
04:28
DAX101 - Time Intelligence - PREVIOUSMONTH()
05:58
DAX101 - Time Intelligence - DATEADD()
10:32
DAX101 - Quick Measures
06:07

Hands-on Real-world Projects

71 lectures
Delicious Pizza Report-0
07:05
Delicious Pizza Report-1
10:10
Delicious Pizza Report-2
08:53
Abank Bank Report-0
09:48
Abank Bank Report-1
10:26
Abank Bank Report-2
09:10
Abank - Create phone layout
04:15
Financial Report-0
09:04
Financial Report-1
08:13
Financial Report-2
05:34
Financial Report-3
06:28
Financial Report-4
04:25
Financial Report-5 & Analytics tab explained
10:30
Personality and looks-0
07:58
Personality and looks-1
09:10
Personality and looks-2
11:27
Productivity Survey by Microsoft Office Team-0
09:44
Productivity Survey by Microsoft Office Team-1
09:55
Productivity Survey by Microsoft Office Team-2
10:48
Productivity Survey by Microsoft Office Team-3
09:49
Productivity Survey by Microsoft Office Team-4
11:03
Toughest Sport by Skills-0
09:22
Toughest Sport by Skills-1
10:34
Toughest Sport by Skills-2
12:03
Natural Disasters-0
08:43
Natural Disasters-1
10:10
Natural Disasters-2
09:57
Natural Disasters-3
07:10
Please watch this first
00:30
Adv - Procurement-Spend Analysis-0
08:00
Adv - Procurement-Spend Analysis-1
08:01
Adv - Procurement-Spend Analysis-2
08:27
Adv - Procurement-Spend Analysis-3
07:31
Adv - Procurement-Spend Analysis-4
09:13
Adv - Product Analysis-0
09:17
Adv - Product Analysis-1
08:45
Adv - Product Analysis-2
11:52
Adv - Product Analysis-3
05:51
Adv - Regional Analysis-0
09:16
Adv - Regional Analysis-1
11:21
Adv - Regional Analysis-2
09:44
Adv - Regional Analysis-3
09:54
Adv - Regional Analysis-4
06:35
Adv - IT-Tickets Analysis-0
09:15
Adv - IT-Tickets Analysis-1
10:06
Adv - IT-Tickets Analysis-2
11:23
Adv - IT-Tickets Analysis-3
09:52
Adv - IT-Tickets Analysis-4
14:10
Adv - Human Resources 1-0
09:22
Adv - Human Resources 1-1
11:20
Adv - Human Resources 1-2
08:15
Adv - Human Resources 1-3
13:41
Adv - Human Resources 2-0
06:33
Adv - Human Resources 2-1
10:37
Adv - Human Resources 2-2
09:30
Adv - Human Resources 3-0
07:45
Adv - Human Resources 3-1
09:29
Adv - Human Resources 3-2
08:53
Adv - Financial Report-0
09:16
Adv - Financial Report-1
08:52
Adv - Financial Report-2
09:31
Adv - Financial Report-3
09:25
Adv - Financial Report-4
05:49
Adv - Sales Report-0
10:33
Adv - Sales Report-1
09:00
Adv - Sales Report-2
04:42
Adv - Bank Report-0
05:18
Adv - Bank Report-1
07:36
Adv - Bank Report-2
08:05
Adv - Bank Report-3
05:35
Adv - Bank Report-4
05:32

Personal - Enterprise Gateway

5 lectures
On-Premises Gateway in Power BI
07:41
Personal vs Enterprise Gateway
03:23
Install and Configure Personal Gateway in Power BI
09:45
Install and Configure Enterprise Gateway
06:00
Manage SQL Server Data Source thru Enterprise Gateway
11:05

Power BI Service and Dashboards

25 lectures
PowerBI Reports in Power BI
00:50
PowerBI Workspaces in Power BI
02:13
PowerBI Datasets in Power BI
02:37
What are Dashboards in Power BI
02:03
How to create Workspace and Publish Report in Power BI
03:28
Create dashboards 6 different ways-0 in Power BI
08:05
Create dashboards 6 different ways-1 in Power BI
11:13
Favorite dashboards, reports, and apps in Power BI in Power BI
02:15
Subscribe to a Report or Dashboard in Power BI
02:34
Rename Workspace or Report or Dashboard in Power BI
04:35
Display Reports or Dashboards in Full screen mode in Power BI
02:37
Delete Reports or Dashboards in Power BI
04:04
Dashboard Menus
12:11
Quick Insights in Power BI
11:19
Setting up Alerts on Cards
05:56
Q-A in Power BI
04:48
Analyze in Excel in Power BI
04:17
File and View Options in Power BI
04:59
Printing Dashboard and Reports in Power BI
03:37
Row level security in Power BI
09:06
Access Reports Dashboards using Mobile Devices in Power BI
09:46
Report page tooltip-0 in Power BI
08:50
Report page tooltip-1 in Power BI
05:02
Filter- Page-Report-Visualization level-0 in Power BI
08:01
Filter- Page-Report-Visualization level-1 in Power BI
08:57

Row Level Security in Power BI

10 lectures
PATH Function in Power BI
09:34
PATHCONTAINS Function in Power BI
04:12
PATHITEM Function in Power BI
03:36
PATHITEMREVERSE Function in Power BI
03:47
PATHLENGTH Function in Power BI
02:45
RLS - Static Row Level Security in Power BI
11:06
RLS - Dynamic Row Level Security in Power BI
11:20
RLS - Organizational Hierarchy 1 in Power BI
11:40
RLS - Organizational Hierarchy 2 in Power BI
11:14
RLS - Organizational Hierarchy 3 in Power BI
04:04

Sharing and Collaboration in Power BI

5 lectures
Sharing and Collaboration in Power BI
03:37
Sharing Dashboard in Power BI
05:16
Sharing Workspaces in Power BI
09:31
Sharing App in Power BI
08:02
Publish To Web in Power BI
05:05

Bonus Lectures

24 lectures
Download Materials
00:05
Power BI : Best Practices, Tips and Tricks 0
10:03
Power BI : Best Practices, Tips and Tricks 1
10:00
Power BI : Best Practices, Tips and Tricks 2
09:57
Power BI : Best Practices, Tips and Tricks 3
09:59
Power BI : Best Practices, Tips and Tricks 4
10:00
Power BI : Best Practices, Tips and Tricks 5
14:09
Dashboard-in-a-day : Download Material link
00:05
Dashboard-in-a-day : Introduction
08:18
Dashboard-in-a-day : Accessing Data
12:55
Dashboard-in-a-day : Data Preparation 0
10:31
Dashboard-in-a-day : Data Preparation 1
09:10
Dashboard-in-a-day : Data modeling and Exploration 0
09:39
Dashboard-in-a-day : Data modeling and Exploration 1
11:40
Dashboard-in-a-day : Data modeling and Exploration 2
09:26
Dashboard-in-a-day : Data modeling and Exploration 3
10:18
Dashboard-in-a-day : Data modeling and Exploration 4
09:39
Dashboard-in-a-day : Data Visualizations 0
15:39
Dashboard-in-a-day : Data Visualizations 1
12:12
Dashboard-in-a-day : Publishing Report
09:41
Dashboard-in-a-day : Creating Dashboards 0
08:53
Dashboard-in-a-day : Creating Dashboards 1
06:30
Dashboard-in-a-day : 6 ways to create Dashboards 0
08:05
Dashboard-in-a-day : 6 ways to create Dashboards 1
11:13

Mega searchable tutorials on Power BI, DAX, SQL and Power Query

1 lectures
Mega searchable tutorials on Power BI, DAX, SQL and Power Query
00:30

Final Words

1 lectures
Congratulations ! You made it
00:58

Đánh giá của học viên

Chưa có đánh giá
Course Rating
5
0%
4
0%
3
0%
2
0%
1
0%

Bình luận khách hàng

Viết Bình Luận

Bạn đánh giá khoá học này thế nào?

image

Đăng ký get khoá học Udemy - Unica - Gitiho giá chỉ 50k!

Get khoá học giá rẻ ngay trước khi bị fix.