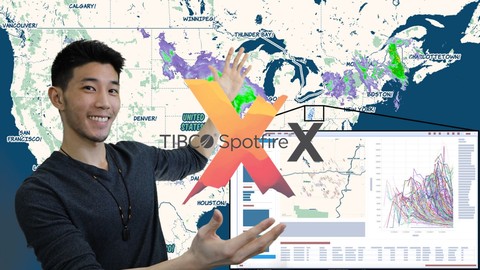
A Practical Guide to TIBCO Spotfire for Business Analytics
Loại khoá học: Business Analytics & Intelligence
Step by Step Guide to Spotfire Dashboard for Business Analytics with Data Visualizations & Analysis
Mô tả
Learn how to use Spotfire to design user-friendly and visually impactful dashboards to transform data into meaningful and actionable insights!
What is Spotfire?
Spotfire is one of the most powerful data analytics platform for delivering business insights from your data with dashboards designed for data management, data wrangling, data visualizations, and advanced data analytics capabilities. Spotfire's user-friendly interface is specifically designed for exploring and visualizing data with interactive dashboards to uncover valuable, decision making insights from your data.
In this course you will learn the fundamentals of Spotfire and the 3 essential components of designing a Spotfire dashboard for data analytics:
Data Table Management & Relationships
Data Visualizations for Analytics
Interactive Dashboard Configurations
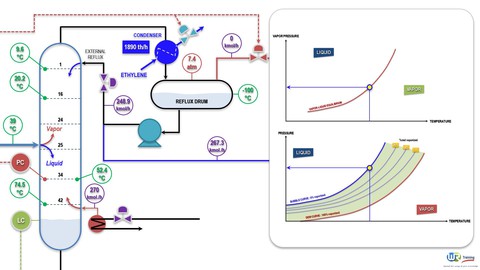
I will be guiding you through this course using practical datasets for real world applications (Public Oil & Gas Well Data), not only will we cover the details of building a Spotfire dashboard, there will also be meaningful exercises, walkthrough solutions, tips and tricks, and useful resources. Together, we will walk through the entire process of designing a professional Spotfire dashboard step by step.
By the end of this course, you will be able to design a fully functional dashboard for data visualization, data analysis, business analytics, and will have mastered the fundamentals of Spotfire!
So, what are you waiting for? Get started on learning how to turn your DATA into INSIGHT!
Bạn sẽ học được gì
Master the fundamentals of TIBCO Spotfire
Learn how to develop visually impactful insights from your data
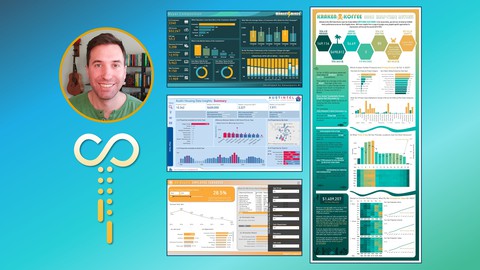
Learn how to create a professional dashboard with stunning data visualization for data analysis and business analytics
Learn the core principles of data management and data relationships
Learn interactive user configurations with enhanced dashboard functionality
Learn how to integrate HTML & JavaScript into Spotfire
Practice building a dashboard with public Oil & Gas datasets
Yêu cầu
- No prior knowledge or experience required.
- Be open minded, creative, and ready to learn!
Nội dung khoá học
Viết Bình Luận
Khoá học liên quan


Đăng ký get khoá học Udemy - Unica - Gitiho giá chỉ 50k!
Get khoá học giá rẻ ngay trước khi bị fix.
Đánh giá của học viên
Bình luận khách hàng