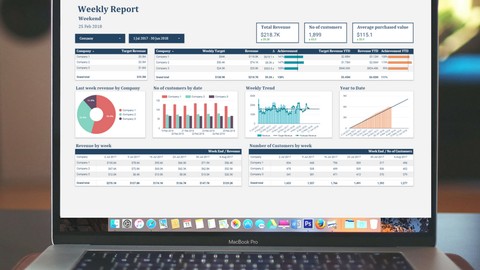
Building Financial Dashboard in Google Data Studio
Loại khoá học: Business Analytics & Intelligence
How to Build Dynamic Financial Dashboard in Google Data Studio From Scratch
Mô tả
- Learn from a Financial business intelligence analyst for a Group of more than 10 companies.
- Create Powerful Interactive Financial Dashboards from Google Sheets Data from scratch.
- No VBA or SQL coding require, just drag and drop, copy and paste.
- Analyze Google Sheets in minutes using powerful visualizations.
- Learn powerful visualizations such as Time Series Charts, Scorecards, Pie Charts, Stacked Area Charts.
- Display comparisons to Previous Period, Previous Year, in one scorecard.
- Create Financial Year to Date Calculations.
- Create filters to easily create interactive dashboards, graphs and reports.
- Create date range selection to easily manage the display range in the charts .
- Share Reports and Updating Data.
- Create pages navigation to make a report look like running in a professional financial software.
- Learn how to Fix error.
- Free access to the report anytime, anywhere by signing in Google Account.
Bạn sẽ học được gì
Creating financial database from financial reports: Profit & Loss, Balance Sheet and Cash Flow Statement
Connecting Data Studio to Google Sheets
Creating powerful time series charts to help with forecasting: monthly revenue, expense, net profit & net profit margin
Creating time range selection to select the time period displayed in the report
Creating filter control of companies or organizations
Creating Scorecards to display key metrics, comparing previous month and previous year performance
Creating Pie charts, Bar charts, Combo charts & Area charts
Creating table & Pivot table, showing total
Creating Calculated field or KPI from existing data.
Creating pages navigation like a financial software
Sharing Report & Updating financial data
Fixing common errors in Google Data Studio
Yêu cầu
- Google Account
- Google Chrome
- Basic Excel/ Google Spreadsheet
Nội dung khoá học
Viết Bình Luận
Khoá học liên quan


Đăng ký get khoá học Udemy - Unica - Gitiho giá chỉ 50k!
Get khoá học giá rẻ ngay trước khi bị fix.
Đánh giá của học viên
Bình luận khách hàng