Mô tả

Data Analysts aim to discover how data can be used to answer questions and solve problems through the use of technology. Many believe this will be the job of the future and be the single most important skill a job application can have in 2020.

In the last two decades, the pervasiveness of the internet and interconnected devices has exponentially increased the data we produce. The amount of data available to us is Overwhelming and Unprecedented. Obtaining, transforming and gaining valuable insights from this data is fast becoming the most valuable and in-demand skill in the 21st century.

In this course, you'll learn how to use Data, Analytics, Statistics, Probability, and basic Data Science to give an edge in your career and everyday life. Being able to see through the noise within data, and explain it to others will make you invaluable in any career.

We will examine over 2 dozen real-world data sets and show how to obtain meaningful insights. We will take you on one of the most up-to-date and comprehensive learning paths using modern-day tools like Python, Google Colab and Google Data Studio.

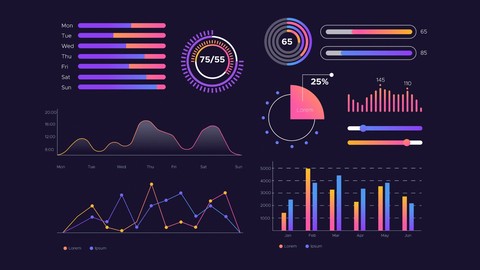
You'll learn how to create awesome Dashboards, tell stories with Data and Visualizations, make Predictions, Analyze experiments and more!

Our learning path to becoming a fully-fledged Data Analyst includes:

  1. The Importance of Data Analytics

  2. Python Crash Course

  3. Data Manipulations and Wrangling with Pandas

  4. Probability and Statistics

  5. Hypothesis Testing

  6. Data Visualization

  7. Geospatial Data Visualization

  8. Story Telling with Data

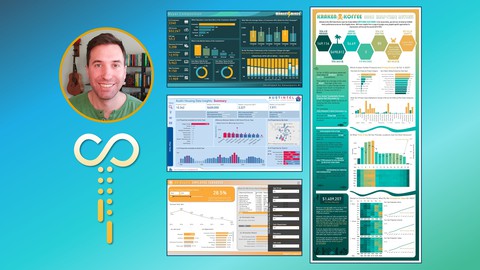
  9. Google Data Studio Dashboard Design - Complete Course

  10. Machine Learning - Supervised Learning

  11. Machine Learning - Unsupervised Learning (Clustering)

  12. Practical Analytical Case Studies

Google Data Studio Dashboard & Visualization Project:

  1. Executive Sales Dashboard (Google Data Studio)

Python, Pandas & Data Analytics and Data Science Case Studies:

  1. Health Care Analytics & Diabetes Prediction

  2. Africa Economic, Banking & Systematic Crisis Data

  3. Election Poll Analytics

  4. Indian Election 2009 vs 2014

  5. Supply-Chain for Shipping Data Analytics

  6. Brent Oil Prices Analytics

  7. Olympics Analysis - The Greatest Olympians

  8. Home Advantage Analysis in Basketball and Soccer

  9. IPL Cricket Data Analytics

  10. Predicting the Soccer World Cup

  11. Pizza Resturant Analytics

  12. Bar and Pub Analytics

  13. Retail Product Sales Analytics

  14. Customer Clustering

  15. Marketing Analytics - What Drives Ad Performance

  16. Text Analytics - Airline Tweets (Word Clusters)

  17. Customer Lifetime Values

  18. Time Series Forecasting - Demand/Sales Forecast

  19. Airbnb Sydney Exploratory Data Analysis

  20. A/B Testing


Bạn sẽ học được gì

Understand the value of data for businesses

The importance of Data Analytics

The role of a Data Analyst

Learn to use Python, Pandas, Matplotlib & Seaborn, Scikit-learn

Learn Visualization Tools such as Matplotlib, Seaborn, Plotly and Mapbox

Hypothesis Testing and A/B Testing - Understand t-tests and p values

Unsupervised Machine Learning with K-Means Clustering

Machine Learning from Linear Regressions (polynomial & multivariate), K-NNs, Logistic Regressions, SVMs, Decision Trees & Random Forests

Advanced Pandas techniques from Vectorizing to Parallel Processsng

Statistical Theory, Probability Theory, Distributions, Exploratory Data Analysis

Ananlytic Case Studies involving Retail, Health, Elections, Sports, Resturants, Airbnb, Uber and more!

Full Tutorial on Google Data Studio for Dashboard Creation

Yêu cầu

  • Familiar with basic programming concepts
  • Highschool level math knowledge
  • Broadband Internet connection

Nội dung khoá học

51 sections

Course Introduction & the Importance of Data Analysts

5 lectures
Course Introduction
07:22
The Importance of Data Analyst
09:53
Why Data is the new Oil
06:37
Making Sense of Buzz Words, Data Science, Big Data, Machine & Deep Learning
07:27
The Roles in the Data World - Analyst, Engineer, Scientist, Statistician, DevOps
04:50

Download Code and Slides and Setup Google Colab

2 lectures
Download Code and Slides
00:08
Download Course Code, Slides and Setup Google Colab for your iPython Notebooks
03:45

Python Crash Course

7 lectures
Why use Python for Data Anakytics and Data Science?
03:05
Python - Basic Variables
06:31
Python - Array/Lists and Dictionaries
11:09
Python - Conditional Statements
06:55
Python - Loops
08:49
Python - Functions
05:29
Python - Classes
08:34

Pandas - Data Series and Manipulation

4 lectures
Introduction to Pandas
02:47
Pandas 1 - Data Series
07:02
Pandas 2A - DataFrames - Index, Slice, Stats, Finding Empty cells, Filtering
17:31
Pandas 2B - DataFrames - Index, Slice, Stats, Finding Empty cells & Filtering
05:51

Pandas - Data Cleaning & Aggregration

3 lectures
Pandas 3B - Data Cleaning - Alter Colomns/Rows, Missing Data & String Operations
08:46
Pandas 3A - Data Cleaning - Alter Colomns/Rows, Missing Data & String Operations
19:45
Pandas 4 - Data Aggregation - GroupBy, Map, Pivot, Aggreate Functions
16:39

Pandas - Feature Engineering & Joins/Merge/Concatenating

2 lectures
Pandas 5 - Feature Engineer, Lambda and Apply
04:24
Pandas 6 - Concatenating, Merging and Joinining
15:21

Pandas - Time Series Data

1 lectures
Pandas 7 - Time Series Data
09:56

Advanced Pandas

3 lectures
Pandas 7 - ADVANCED Operations - Iterows, Vectorization and Numpy
11:17
Pandas 8 - ADVANCED Operations - More Map, Zip and Apply
04:29
Pandas 9 - Advanced Operations - Parallel Processing
04:24

Map Visualizations

2 lectures
Map Visualizations with Plotly - Cloropeths from Scratch - USA and World
11:25
Map Visualizations with Plotly - Heatmaps, Scatter Plots and Lines
04:54

Statistics for Data Analysts & Visualizations

16 lectures
Introduction to Statistics
04:20
Descriptive Statistics - Why Statistical Knowledge is so Important
03:47
Descriptive Statistics 1 - Exploratory Data Analysis (EDA) & Visualizations
16:19
Descriptive Statistics 2 - Exploratory Data Analysis (EDA) & Visualizations
06:22
Sampling, Averages & Variance And How to lie and Mislead with Statistics
03:16
Variance, Standard Deviation and Bessel’s Correction
09:22
Types of Variables - Quantitive and Qualitative
05:41
Frequency Distributions
04:41
Frequency Distributions Shapes
02:55
Analyzing Frequency Distributions - What is the Best Type of Wine? Red or White?
09:58
Covariance & Correlation - Do Amazon & Google know you better than anyone else?
11:35
Sampling - Sample Sizes & Confidence Intervals - What Can You Trust?
09:41
Mean, Mode and Median - Not as Simple As You'd Think
12:38
The Normal Distribution & the Central Limit Theorem
03:43
Lying with Correlations – Divorce Rates in Maine caused by Margarine Consumption
01:37
Z-Scores
08:16

Probability Theory

5 lectures
Probability - An Introduction
01:40
Estimating Probability
05:14
Addition Rule
07:58
Permutations & Combinations
06:54
Bayes Theorem
07:49

Hypothesis Testing

4 lectures
Hypothesis Testing Introduction
03:03
Statistical Significance
08:13
Hypothesis Testing – P Value
07:43
Hypothesis Testing – Pearson Correlation
05:25

Google Data Studio - Introduction & Setup

2 lectures
All about Google Data Studio
05:06
Opening Google Data Studio and Uploading Data
04:27

Google Data Studio - Your First Dashboard

3 lectures
Your First Dashboard Part 1
14:29
Your First Dashboard Part 2
10:02
Creating New Fields
05:37

Google Data Studio - Pivot & Dynamic Tables (with Filters)

2 lectures
Pivot Tables
06:39
Dynamic Filtered Tables
02:53

Google Data Studio - Scorecards and Time Comparison

2 lectures
Scorecards
06:10
Scorecards with Time Comparison
05:44

Google Data Studio - Bar Charts, Line Charts and Time Series Plots

3 lectures
Bar Charts
08:44
Line Charts
07:01
Time Series and Comparitive Time Series Plots
04:52

Google Data Studio - Pie charts, Donut Charts, Treemaps & Scatter Plots

2 lectures
Pie Charts, Donut Charts and Tree Maps
04:01
Scatter Plots
04:50

Google Data Studio - Geographic & Map Plots

1 lectures
Google Data Studio - Geographic & Map Plots
07:21

Google Data Studio - Bullet and Line Area Plots

1 lectures
Google Data Studio - Scatter Plots
05:32

Google Data Studio - Sharing your Interactive Dashboards

1 lectures
Google Data Studio - Sharing your Interactive Dashboards
06:57

Retail Sales Dashboard for Executives

1 lectures
Homework Project - Create Executive Sales Dashboard
02:19

Introduction to Machine Learning

3 lectures
How Machine Learning enables Computers to Learn
03:24
What is a Machine Learning Model?
06:21
Types of Machine Learning
07:41

Linear Regressions

3 lectures
Linear Regression – Introduction to Cost Functions and Gradient Descent
09:11
Linear Regressions in Python from Scratch and using Sklearn
14:18
Polynomial and Multivariate Linear Regression
08:29

Classification - Logistic Regression, SVM, Decision Trees, Random Forets & KNN

4 lectures
Logistic Regression
11:39
Support Vector Machines (SVMs)
05:36
Decision Trees and Random Forests & the Gini Index
10:45
K-Nearest Neighbors (KNN)
05:44

Assessing Model Performance

3 lectures
Assessing Performance – Confusion Matrix, Precision and Recall
22:37
Understanding the ROC and AUC Curve
06:39
What Makes a Good Model? Regularization, Overfitting, Generalization & Outliers
16:16

Neural Networks Overview

2 lectures
Introduction to Neural Networks
02:07
Types of Deep Learning Algoritms CNNs, RNNs & LSTMs
07:38

Unsupervised Learning

4 lectures
Introduction to Unsupervised Learning
04:56
K-Means Clustering
09:34
Choosing K – Elbow Method & Silhouette Analysis
07:50
K-Means in Python - Choosing K using the Elbow Method & Silhoutte Analysis
10:06

Dimensionality Reduction

3 lectures
Principal Component Analysis
09:37
t-Distributed Stochastic Neighbor Embedding (t-SNE)
05:37
PCA & t-SNE in Python with Visualization Comparisons
05:21

Case Study 1 - Airbnb Sydney Exploratory Data Analysis

2 lectures
Case Study Note
00:11
Understanding the Problem + Exploratory Data Analysis and Visualizations
19:53

Case Study 2 - Retail Product Sales Analytics

3 lectures
Data Cleaning and Preparation
08:44
Sales and Revenue Analysis
10:34
Analysis per Country, Repeat Customers and Items
11:49

Case Study 3 - Marketing Analytics - What Drives Ad Performance

2 lectures
Understanding the Problem + Exploratory Data Analysis and Visualizations
08:42
Data Preparation and Machine Learning Modeling
08:32

Case Study 4 - Customer Clustering for Travel Agency Customers

5 lectures
Data Exploration & Description
06:47
Simple Exploratory Data Analysis and Visualizations
09:45
Feature Engineering
08:35
K-Means Clustering of Customer Data
13:05
Cluster Analysis
04:15

Case Study 5 - Text Analytics - Airline Tweets (Word Clusters)

3 lectures
Understanding our Dataset and Word Clouds
07:01
Visualizations and Feature Extraction
10:17
Training our Model
06:31

Case Study 6 - Customer Lifetime Value (CLV)

2 lectures
Understanding the Problem + Exploratory Data Analysis and Visualizations
07:05
Customer Lifetime Value Modeling
06:42

Case Study 7 - Health Care Analytics - Predict Diabetes

3 lectures
Understanding and Preparing Our Healthcare Data
08:11
First Attempt - Trying a Naive Model
03:53
Trying Different Models and Comparing the Results
06:29

Case Study 8 - Africa Economic, Banking & Systematic Crisis Data

2 lectures
Economic Dataset Understanding
05:14
Visualizations and Correlations
07:42

Case Study 9 - 2016 US President Election Analysis

9 lectures
Understanding Polling Data
07:51
Cleaning & Exploring our Dataset
05:55
Data Wrangling with our Dataset
04:54
Understanding the US Electoral System
06:19
Visualizing our Polling Data
04:06
Statistical Analysis of Polling Data
03:43
Polling Simulations
10:42
Polling Simulation Result Analysis
07:19
Visualizing our results on a US Map
04:32

Case Study 10 - Election Results Analysis - Indian Election 2009 vs 2014

3 lectures
Intro
07:33
Visualizations of Election Results
09:29
Visualizing Gender Turnout
10:59

Case Study 11 - Supply-Chain for Shipping Data Analytics

3 lectures
Understanding our Dataset
04:04
Visualizations and EDA
09:21
More Visualizations
04:32

Case Study 12 - Sports Analytics - Olypmics Analysis - The Greatest Olympians

3 lectures
Getting The Medals Per Country
09:30
Getting The Medals Per Country
09:30
Analyzing the Winter Olympic Data and Viewing Medals Won Over Time
05:42

Case Study 13 - Home Advantage Analysis in Basketball and Soccer

3 lectures
Understanding Our Dataset and EDA
09:27
Goal Difference Ratios Home versus Away
05:09
How Home Advantage Has Evolved Over. Time
05:09

Case Study 14 - IPL Cricket Data Analytics

3 lectures
Loading and Understanding our Cricket Datasets
07:25
Man of Match and Stadium Analysis
05:50
Do Toss Winners Win More? And Team vs Team Comparisons
07:08

Case Study 15 - Predicting the World Cup Winner (Soccer/Football)

4 lectures
Understanding and Preparing Our Soccer Datasets
06:05
Feature Extraction using our Soccer Data
05:07
Predicting Game Outcomes with our Model
06:20
Simulating the World Cup Outcome with Our Model
13:30

Case Study 16 - Pizza Resturants Analysis

3 lectures
Understanding our Dataset
06:48
Analysis Per State
04:46
Pizza Maps
07:24

Case Study 17 - Brewery and Pub Analysis

1 lectures
EDA, Visualizations and Map
13:41

Case Study 18 - EDA and Forecasting Brent Oil Prices

3 lectures
Understanding our Dataset and it's Time Series Nature
05:08
Creating our Prediction Model
05:07
Making Future Predictions
12:56

Case Study 19 - Time Series Forecasting for Sales

1 lectures
Case Study 19 - Time Series Forecasting for Sales
00:11

Case Study 20 - Predicting Insurance Premiums

2 lectures
Understanding the Problem + Exploratory Data Analysis and Visualizations
10:10
Data Preparation and Machine Learning Modeling
12:44

Case Study 21 – A/B Testing

5 lectures
Understanding the Problem + Exploratory Data Analysis and Visualizations
10:49
A/B Test Result Analysis
05:37
A/B Testing a Worked Real Life Example - Designing an A/B Test
08:16
Statistical Power and Significance
06:58
Analysis of A/B Test Resutls
08:15

Covid-19 Data Analysis and Flourish Bar Chart Race Visualization

9 lectures
Understanding Our Covid-19 Data
07:31
Analysis of the most Recent Data
05:46
World Visualizations
08:54
Analyzing Confirmed Cases in each Country
04:29
Mapping Covid-19 Cases
05:56
Animating our Maps
04:47
Comparing Countries and Continents
04:50
Flourish Bar Chart Race - 1
10:58
Flourish Bar Chart Race - 2
09:52

Đánh giá của học viên

Chưa có đánh giá
Course Rating
5
0%
4
0%
3
0%
2
0%
1
0%

Bình luận khách hàng

Viết Bình Luận

Bạn đánh giá khoá học này thế nào?

image

Đăng ký get khoá học Udemy - Unica - Gitiho giá chỉ 50k!

Get khoá học giá rẻ ngay trước khi bị fix.