Mô tả

Data Warehousing

Learning how to extract, clean and load data into a SQL database warehouse are highly required skills for data analysis field. You will learn in this course how to use Microsoft Excel to clean your data before loading them into a Microsoft SQL Server database. You will learn how to use SQL Server Integration Services (SSIS) which is one of Microsoft Business Intelligence tools to perform ETL process. You will learn a simple technique that save you a lot of time and help to avoid many possible errors during the ETL process. You will learn also how to use SQL Server Reporting Services (SSRS) to create business reports and  data analysis with SQL queries. This course is designed to be more practical by putting your hands on real projects with diverse business scenarios to learn by practice.  Learning via practice is the best way to get knowledge stuck in your mind because it is similar to acquire experience through work. 
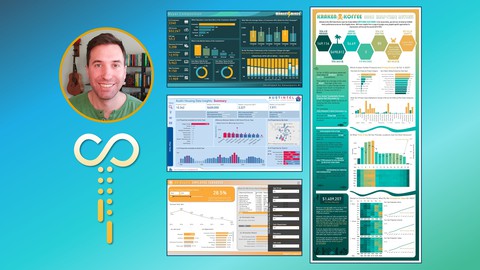
Power BI

Converting raw data to insightful diagrams and charts to make informative decisions is a crucial analytical skill in data science. You will learn in this course how to create insightful and powerful charts and perform data analysis. First, you will understand data visualization, and why data visualization. After that you will understand Power BI services and the use of each of them. After you became familiar with these services you will learn how to install and navigate in Power BI Desktop. After that, you will learn how to use the advanced functions in Power BI Editor in data preparation and cleaning. You will learn appending and merging datasets to create one dataset. After that you will learn how to turn your datasets into insightful charts using many powerful functions. You will learn how to filter your data according to your business requirements. You will learn how to create measures and calculated columns for your own data analysis. You will have an introduction to DAX language where you can learn how to create new tables and columns according to your needs. After that you will learn how to take your projects in the Cloud where you can work with other users. You will learn how use Power BI Pro interface to create, edit and share reports with others.

Bạn sẽ học được gì

Understand Data Warehousing Terminology

Understand the difference between OLTP and OLAP

Install and use MS SQL Server and SQL Server Management Studio

Install and use Microsoft Business Intelligence tools (SSIS and SSRS)

Understand and use how to extract, transform, and load data (ETL process) with SSIS

Introduced to different Flat files

Clean CSV files using Microsoft Excel

Use simple and efficient ETL that avoid many of expecting errors

USE SSRS to create different types of business reports

Practice data analysis while creating SSRS reports

Yêu cầu

  • Basic knowledge of SQL

Nội dung khoá học

21 sections

Introduction

12 lectures
Introduction to course
03:42
Course contents
02:13
Control the pace of a video
00:44
What is Data Warehousing
00:54
Which of the following steps is not part of data warehousing
1 question
OLTP and OLAP
02:55
Which of the following is not a characteristic of OLAP
1 question
What is ETL
01:28
Which of the following two is correct
1 question
What is Data Management
01:03
Which of the following is not part of data management
1 question
Course Rating
00:16

Database Management System

4 lectures
What is Relational Database Management System (RDBMS)
01:15
Which one of the following is not a database management system
1 question
Install MS SQL Server and Management Studio
02:39
Introduction to SQL Server Management Studio (SSMS)
02:44

Introduction to Microsoft Business Intelligence

2 lectures
Introduction to Microsoft Business Intelligence
01:45
Install MS Business Intelligence package
02:22

ETL Project 1 (Companies Expenses and Profits)

8 lectures
Data types in MS SQL Server
03:51
Overview on the data file
03:49
Clean the data in MS Excel
07:25
Create the database in SSMS
02:11
Create the SSIS project in MS Visual Studio Shell for the ETL process - Part 1
09:21
Create the SSIS project in MS Visual Studio Shell for the ETL process - Part 2
01:54
Create the working table in SSMS for data analysis
04:07
Course Rating
00:16

ETL Project 2 (Car Sales)

6 lectures
Overview on the data file
01:05
Clean the data file in MS Excel
05:38
Create the database in SSMS
00:59
Create the SSIS project in MS Visual Studio Shell for the ETL process
05:48
Create the working table in SSMS for data analysis
05:24
Course Rating
00:16

ETL Project 3 (Boston Crimes)

7 lectures
Clean the data file in MS Excel
03:51
Create the warehouse database in SSMS
00:35
Create the SSIS project in MS Visual Studio Shell - Part 1
10:38
Check the anomalies rows
02:40
Create the working table in SSMS for data analysis
05:06
Homework
00:58
Homework Solution
04:54

ETL Project 4 (Movies Data)

3 lectures
Clean the data file in MS Excel
04:41
Create the warehouse database in SSMS and ETL SSIS project
04:19
Create the working table in SSMS for data analysis
06:41

ETL Project 5 (Bank Customers Complaints)

4 lectures
Clean the data file in MS Excel
02:50
Create the warehouse database in SSMS and ETL SSIS project
03:45
Create the working table in SSMS for data analysis - Part 1
03:02
Create the working table in SSMS for data analysis - Part 2
04:38

ETL Homework Project

1 lectures
Introduction to homework
01:32

SSRS Project1 (Companies Expenses and Profits)

3 lectures
Create SSRS Project and Report
03:43
Create Datasource, Dataset, and Table
05:33
Add formatting to report
04:11

SSRS Project 2 (Movies Data)

6 lectures
Create SSRS project and a report
06:58
Use Group by in the report
06:13
Use visibility and hidden functions in the report
05:24
Add calculated field to the report
03:59
Add parameters to the report - Part 1
05:12
Add parameters to the report - Part 2
05:31

SSRS Project 3 (Employee Reviews)

5 lectures
Create SSRS project and report
07:57
Use visibility and hidden functions in report
04:28
Use parameters to filter report data
02:54
Use matrix in report
04:04
Create a chart to visualize data
07:15

SSRS Project 4 (Cars Sales)

3 lectures
Create SSRS project and report
07:46
Create a chart to visualize data
05:15
Use matrix in report
01:26

SSRS Project 5 (Boston Crimes)

5 lectures
Create SSRS project and report
07:03
Use Group by in report - Part 1
06:35
Use Group by in report - Part 2
04:21
Use Group by in report - Part 3
05:57
Create a chart to visualize data
04:31

SSRS Homework Project

1 lectures
Introduction to homework
02:58

ETL Homework Project Solution

4 lectures
Clean dataset in MS Excel
05:19
Implement ETL prcess - Part 1
06:30
Implement ETL prcess - Part 2
03:25
Create Work Table for data analysis in SSMS
06:45

SSRS Homework Project Solution

10 lectures
Number of issues
03:54
Number of issues per year
03:02
Products have most issues
02:50
States have most issues
01:40
Number of issues per bank(company)
01:20
Number of issues that are not timely response
01:51
Issues that are not closed yet
02:55
Create a report using a matrix to address the number of issues per bank and year
03:48
Create a chart showing number of issues in every month
04:00
Final Course Rating
00:14

Introduction to Data Visualization

6 lectures
Introduction to Course
02:39
Introduction to Section 1
00:26
What is Power BI
04:42
Install Power BI Desktop
03:22
Change setting in Power BI Desktop
02:08
Start Power BI Desktop
02:39

Data Cleaning and Preparation

28 lectures
Overview on the business dataset
01:08
Connect to a data source
01:11
Remove N/A rows and use first row as headers names
03:08
Introduction to Pivot and Unpivot operators
03:45
Unpivoting columns
01:40
Split columns and change data types
04:23
Other ways to split columns
04:57
Introduction to M Language
01:29
Remove empty rows from a dataset
03:46
Identify the granular data level in the dataset
03:54
Remove duplicated rows in a dataset
03:30
Connect to another data source
02:09
Introduction to Append operator
02:47
Append queries in Power BI Query Editor
03:26
Introduction to data types in Power BI
02:34
Set proper data types in a dataset
04:20
Fix a data conversion error
03:05
Introduction to Star Schema Model
04:17
Create a Star Schema Model in Power BI
02:33
Create the Country dimension table
07:13
Create the Product and Segment dimensions tables
03:26
Create the Fact Sales table
02:42
Introduction to the Merge operator
04:33
Merge queries in Power Query Editor
02:47
Organize datasets in groups
00:55
More useful functions in Power Query Editor
02:33
Disable loading unused files into Power BI
03:07
Project 2 file in Power BI
00:09

Data Visualization

26 lectures
Introduction to Data Visualization
03:04
Create the first chart
05:13
Filter data in charts
02:42
Use top N feature in filters
01:34
Formatting charts part-1
02:59
Formatting charts part-2
03:30
Add analytical lines to charts
02:44
Fix the merging problems between queries
03:30
Create a TreeMap chart
01:56
Advanced color formatting in charts
02:09
Add Slicer to charts
02:43
Create a Map chart
01:56
Measure vs Calculated column
01:22
Create a measure in Power BI Desktop
03:43
Create a calculated column
03:55
Create a Pie chart
01:16
Prepare a time series dataset
04:08
Create a Line chart
03:45
Drilling in a Hierarchy dimensions
02:31
Change themes of reports
01:07
Introduction to DAX Language
02:31
Arithmetic functions in DAX
01:35
DAX operators
00:58
Date functions in DAX
02:24
Logical functions in DAX
02:41
Text concatenation functions in DAX
01:15

Work on Projects in the Cloud with Power BI Pro

9 lectures
Introduction to Power BI Pro
01:16
Login to Power BI Pro
02:16
Quick overview on Power BI Pro interface
02:04
Browse and edit projects in Power BI Pro
04:29
Create a Dashboard in Power BI Pro
03:23
Overview on My workspace in Power BI Pro
04:53
Install a Gateway
03:50
Overview on Workspaces in Power BI Pro
01:23
Apps in Power BI Pro
01:34

Đánh giá của học viên

Chưa có đánh giá
Course Rating
5
0%
4
0%
3
0%
2
0%
1
0%

Bình luận khách hàng

Viết Bình Luận

Bạn đánh giá khoá học này thế nào?

image

Đăng ký get khoá học Udemy - Unica - Gitiho giá chỉ 50k!

Get khoá học giá rẻ ngay trước khi bị fix.