Mô tả

A traditional debugger allows you to inspect the system state once the system is halted

i.e., after an error has been detected, but doesn’t reveal the events leading to the error.

To understand why an event took place, the relevant context has to be restored. This requires tracing

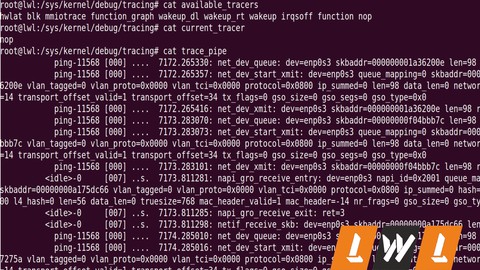
Tracing is the process of collecting information on the activity in a working system

With tracing, program execution is recorded during run-time, allowing for later analysis of the trace

Tracing provides developers with information useful for debugging.

In this course, we will be learning ftrace, which is the official tracer of Linux Kernel in deep

What can we do using ftrace?

-----------------------------

Debugging Linux Kernel

Analyzing Latencies in Linux Kernel

Learn and observe the flow of Linux Kernel

Trace context switches

Length of the time the interrupts are disabled

       And many more

Bạn sẽ học được gì

Linux Kernel Debugging Techniques

Yêu cầu

  • Should have knowledge in Linux Kernel

Nội dung khoá học

6 sections

Introduction to ftrace

18 lectures
Introduction to Tracing
02:09
Introduction to ftrace
02:14
Check Whether ftrace is enabled in kernel
05:44
Important files in tracefs
03:44
Enabling a different tracer
05:09
Function Graph Tracer
05:34
Filtering functions
11:28
Wildcard Characters in filters
02:54
Question and Answer
01:04
ftrace on simple kernel module
11:15
Enabling and Disabling tracing
02:52
trace vs trace_pipe
03:45
Find out what calls made by a kernel function
05:52
Tracing a specific process
06:32
Tracing functions of specific module
03:38
trace_printk
06:32
Tracing kernel functions with a particular duration
02:49
Finding out how user space code gets into kernel
02:29

ftrace continued

18 lectures
irqs-off
02:26
need-resched
04:42
Hardirq, softirq or process context
03:56
preempt-depth
04:23
Start/Stop tracing on a particular function
08:01
trace_options file
07:14
options directory
02:27
Disabling interrupt information from function_graph
02:34
Who is calling a particular kernel function
04:48
trace_marker
02:21
trace_marker from userspace
02:59
Kernel function profiling
03:33
Find maximum time interrupt are disabled
06:15
Example of irqsoff tracer
03:30
Finding latencies at boot
05:49
Finding deepest kernel stack
04:53
ftrace dump on oops
02:10
snapshot
02:35

Tracing Events

12 lectures
Introduction to Tracepoints
04:17
Introduction to Tracing Events
11:36
Format file
06:46
Filter File
14:29
More examples of setting filter
10:20
Subsystem Filters
06:15
Event Triggers
12:26
Histograms
12:19
set_event interface
05:21
Event PID Filtering
01:46
Example of set_event_pid
04:06
Tracing Events at boot
01:05

Interesting Trace Events

11 lectures
mkdir
06:46
Can i Change format of event
00:50
USB Events
03:04
Scheduling Events
06:25
Exception Events
05:44
module events
05:38
ext4 events
09:47
fs events
04:30
irq events
16:25
net events
04:30
Beaglebone events
09:26

trace-cmd

10 lectures
Introduction
02:45
trace-cmd list
08:48
trace-cmd stat
03:37
trace-cmd start and trace-cmd stop
11:06
trace-cmd show
03:54
trace-cmd reset
03:22
trace-cmd Function Filtering
03:22
trace-cmd Pid Filtering
03:29
trace-cmd record and trace-cmd report
10:43
trace-cmd extract
03:07

Notes

1 lectures
Downloads
00:01

Đánh giá của học viên

Chưa có đánh giá
Course Rating
5
0%
4
0%
3
0%
2
0%
1
0%

Bình luận khách hàng

Viết Bình Luận

Bạn đánh giá khoá học này thế nào?

image

Đăng ký get khoá học Udemy - Unica - Gitiho giá chỉ 50k!

Get khoá học giá rẻ ngay trước khi bị fix.