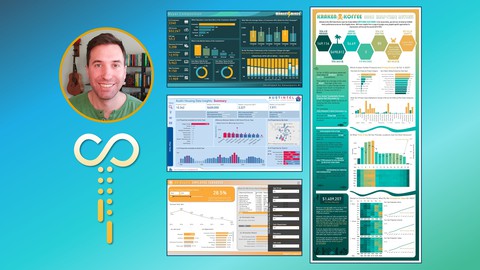
Google Data Studio - Master the Advanced Concepts
Loại khoá học: Business Analytics & Intelligence
Build on your knowledge of Data Studio to make your dashboards more impactful than ever. Connect to BigQuery and more.
Mô tả
In this course you'll master the advance features in Google Data Studio, so that you understand all the options available for transforming your data sets and data visualisations into the format you need.
Target Audience
This course is for people who have an intermediate knowledge of Google Data Studio and want to gain advance knowledge.
- You already have experience with Data Studio
- You have experience with Functions in Excel and/or Basic knowledge of SQL
- Want to understand the full range of capabilities that Google Data Studio offers
Curriculum
In this course you will cover in detail:
Visualisations - Pivot Tables, Combination & Dual Axis Charts, Stacked Bar & Area Charts
Layout - How to set global colour palettes
Transforming Data Sets - Transforming Metrics & Dimensions with Calculated Fields and a range of functions that Data Studio supports e.g Median(), Variance(), Percentile(), Concat(), Substr() as well as Case Statements for grouping dimension values together.
Hyperlinks and Clickable images - Adding images and links to data tables to show and link through to your products in your reports
Filters - Group and Page Level filters to add more control to your reports
Embedding - How to embed your reports into an external application or website.
Databases - Connecting to SQL database tables, views and custom queries. We will connect to BigQuery.
Roles
Your role might fall into one of the following
Online Marketer
Product Analyst
Data Analyst
Finance Anayst
Product Owners/Manager
Small business Owner
Data Sources you may already use
Google Analytics, Adwords or other Google Product
Google Sheets
Excel
SQL Database e.g MySQL, BigQuery, PostGresQL
The Power of Data Studio
- Intuitive Design - create dashboard designs that are more intuitive than dashboards in GA & Google Sheets
- Scale your insights - build shareable dashboards saved in Google Drive
- Speed up time to insight - build reports and visualisations to answer questions within minutes
- User friendly Templates and Layouts - will make it easier for users to interpret the data.
Data Studio is a Data Visualisation Tool created by Google. It is part of the Google Suite including Google Docs, Google Sheets and Google Slides.
Data Studio is FREE and allows you to connect to a range of data sources.
It's an incredible tool to create powerful and interactive dashboards for you to explore your underlying data.
I look forward to showing you how to master the advance concepts in Google Data Studio so that you understand the full range of capabilities at your fingertips.
Bạn sẽ học được gì
You will be able to take your Reports to the next level by understanding the advance features in Google Data Studio
Transform your data sets using advance Calculated Fields (we explore a wide range of function and conditional case statements)
Enhance your data visualiations by using pivot charts, combination charts and hyperlinks and product images in tables
Learn how to embed your reports into an external application e.g website or blog
Connect to Databases including BigQuery - Learn how to write custom queries in Data Studio
Advance Filter options such as Page and Report Level Filters
Yêu cầu
- Existing Knowledge of Google Data Studio
- Knowledge of Google Sheets & Google Analytics
- Knowledge of Excel Formulas and/or Basic SQL Functions
- Google Account
Nội dung khoá học
Viết Bình Luận
Khoá học liên quan

Đăng ký get khoá học Udemy - Unica - Gitiho giá chỉ 50k!
Get khoá học giá rẻ ngay trước khi bị fix.


Đánh giá của học viên
Bình luận khách hàng