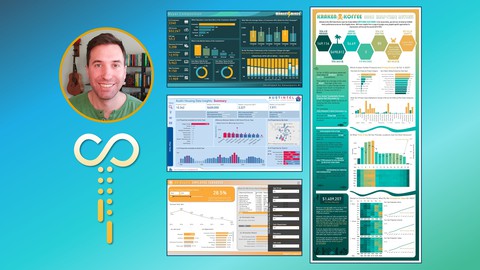
Microsoft Power BI: The Art of Designing Incredible Tools
Loại khoá học: Business Analytics & Intelligence
Learn how art, psychology, design, data, and business acumen combine to create incredible Microsoft Power BI tools.

Mô tả
Microsoft Power BI: The Art of Designing Incredible Tools is a course focused on what it means to design beautiful reports and dashboards. Are you a Power BI builder struggling with how to design tools that look as amazing on the front-end as they are in the back-end? You're in the right place! Where other wonderful courses teach the technical aspects of Power BI that help aspiring BI engineers wrangle data, transform it, visualize it, and publish tools across their company, this course is focused specifically on the art of designing tools that look amazing, tell meaningful data stories, and deliver a wonderful online user experience.
In this course, learn about some foundational design techniques based in Gestalt psychology, learn how to refine your use of color to make the most important insights "pop", learn how data storytelling is very different from traditional narrative storytelling, and learn about the many things that BI tools and video games have in common when it comes to user experience. In 15 hours, you're not guaranteed to learn everything there is to learn about design and data storytelling, but you will receive the exposure necessary to elevate your BI tools from collections of data visuals into gorgeous "tools" that marry data visualization, design, color, text, imagery, and other stylistic elements in order to invite your users into your creations.
Bạn sẽ học được gì
Master the principles of Gestalt design and learn how to apply smart design techniques to business intelligence reports, as well as common mistakes to avoid.
Learn how to apply color strategically in your tools to ensure maximum readability and guide your users through the most important insights in your tools.
Learn how to find the story and dissect datasets in order to create compelling narratives that propel business users towards insights and, ultimately, action.
Use common business tools and built-in Power BI functionality to engineer design and navigation experiences for your users that will immerse them in your tool.
Apply common web design techniques to business intelligence tools, transforming your creations from semi-interactive reports into complex data-driven web tools.
Learn how to conceptualize and deliver a front-end design experience from start to finish, using a free UFO sightings dataset.
Yêu cầu
- Basic data visualization experience is a requirement for this tool and familiarity with data modeling concepts will be extremely helpful. No DAX or Power Query experience is required for this course.
Nội dung khoá học
Viết Bình Luận
Khoá học liên quan


Đăng ký get khoá học Udemy - Unica - Gitiho giá chỉ 50k!
Get khoá học giá rẻ ngay trước khi bị fix.
Đánh giá của học viên
Bình luận khách hàng